
Capturing VM Memory with VirtualBox debugvm and Converting ELF to Raw Format

Introduction
Memory forensics is a critical component of malware analysis, allowing analysts to examine the runtime state of malicious software, decrypt in-memory strings, extract injected code, and identify persistence mechanisms that may not be visible on disk. However, capturing clean, usable memory dumps from virtual machines can be challenging.
In this guide, we’ll explore how to use VirtualBox’s built-in debugging interface to capture memory dumps and convert them to a format compatible with forensic tools like Volatility.
Why Use VBoxManage debugvm?
When analyzing malware in a VirtualBox VM, you have several options for memory capture:
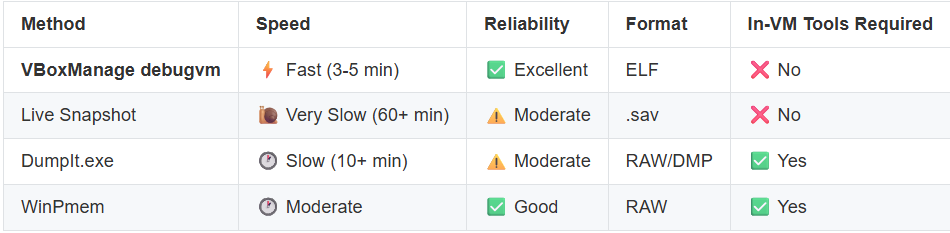
VBoxManage debugvm offers the best combination of speed, reliability, and simplicity. It:
Requires no tools inside the VM (avoiding malware interference)
Works on both running and paused VMs
Uses VirtualBox’s native debugging interface
Produces consistent, complete memory dumps
Prerequisites
Before you begin, ensure you have:
VirtualBox installed (tested with 6.1+)
Volatility 2.6 Standalone - REQUIRED for ELF to RAW conversion
Download: Volatility 2.6 Standalone Executable (Windows)
Download: Volatility 2.6 Source (Linux/macOS)
Important: Volatility 3 does NOT have the
imagecopyplugin - you MUST use version 2.6 for conversion
A running VirtualBox VM with malware to analyze
Sufficient disk space (memory dump = VM RAM size, typically 4-8 GB)
Why Volatility 2.6? Volatility 3 removed the
imagecopyplugin, making it impossible to convert ELF dumps to raw format. You must use Volatility 2.6 for the conversion, but you can then analyze the resulting raw dump with either Volatility 2.6 or Volatility 3.
Step 1: Prepare Your Analysis Environment
First, set up your directories:
# Create analysis directory structure
mkdir -p ~/malware_analysis/memory_dumps
mkdir -p ~/malware_analysis/volatility_output

# Navigate to working directory
cd ~/malware_analysis
Step 2: Pause the VM (Optional but Recommended)
Pausing the VM before capturing memory ensures a consistent snapshot without ongoing changes:
# List running VMs to get the exact name
VBoxManage list runningvms

# Pause the VM to freeze its state
VBoxManage controlvm "YourVMName" pause
Output:
# VM state will change from "running" to "paused"
Why pause first?
Ensures memory state doesn’t change during dump
Prevents malware from detecting the dump operation
Creates a consistent timeline for forensic analysis
Step 3: Capture Memory with debugvm dumpvmcore
Now, use VirtualBox’s debug interface to dump the VM’s physical memory:
# Capture memory dump (replace YourVMName and path)
VBoxManage debugvm "YourVMName" dumpvmcore \
    --filename=~/malware_analysis/memory_dumps/malware_sample_$(date +%Y%m%d_%H%M%S).elf
Example with actual VM name:
VBoxManage debugvm "Windows10-Malware-Lab" dumpvmcore \
    --filename=~/malware_analysis/memory_dumps/Malware_20251219_143022.elf
Expected output:
Dumping guest memory to '/home/analyst/malware_analysis/memory_dumps/Malware_20251219_143022.elf'...
Timing:
2 GB RAM: ~1-2 minutes
4 GB RAM: ~3-5 minutes
8 GB RAM: ~5-8 minutes
Step 4: Resume the VM
After capturing the dump, resume the VM if you paused it:
# Resume the paused VM
VBoxManage controlvm "YourVMName" resume

# Or if you're done analyzing, power it off
VBoxManage controlvm "YourVMName" poweroff
Step 5: Verify the ELF Dump
Check that the dump was created successfully:
# List the dump file
ls -lh ~/malware_analysis/memory_dumps/

# Verify it's an ELF file
file ~/malware_analysis/memory_dumps/Malware_20251219_143022.elf
Expected output:
-rw-r--r-- 1 analyst analyst 4.0G Dec 19 14:35 Malware_20251219_143022.elf

Malware_20251219_143022.elf: ELF 64-bit LSB core file, x86-64, version 1 (SYSV)
Step 6: Convert ELF to Raw Format with Volatility 2.6
⚠️ IMPORTANT: You MUST use Volatility 2.6 for this step!
Volatility 3 does NOT include the
imagecopyplugin. Theimagecopycommand was removed in Volatility 3, making it impossible to convert ELF dumps to raw format. You must use Volatility 2.6 for the conversion.After conversion, you can analyze the raw dump with either Volatility 2.6 or Volatility 3.
Volatility 2.6 can work with ELF dumps directly, but many analysis tools and Volatility 3 prefer raw format. Here’s how to convert:
Using Volatility 2.6 Standalone (Windows)
If you’re using the Windows standalone executable:
Navigate to Volatility directory
cd C:\Tools\volatility_2.6_win64_standalone

Convert ELF to raw format
volatility_2.6_win64_standalone.exe ^
    -f "E:\malware_analysis\memory_dumps\Malware_20251219_143022.elf" ^
    imagecopy ^
    -O "E:\malware_analysis\memory_dumps\Malware_20251219_143022.raw"
Using Volatility 2.6 Python (Linux/macOS)
If you’re using the Python version:
# Navigate to Volatility directory
cd ~/tools/volatility

# Convert ELF to raw format
python vol.py \
    -f ~/malware_analysis/memory_dumps/ransomware_20251219_143022.elf \
    imagecopy \
    -O ~/malware_analysis/memory_dumps/ransomware_20251219_143022.raw
Important Notes:
Replace
Win10x64_19041with your actual VM’s profile (see “Determining the Profile” section below)The
-fflag specifies the input ELF fileThe
-Oflag specifies the output raw fileThe conversion process takes 2-5 minutes depending on size
Expected output:
Volatility Foundation Volatility Framework 2.6.1
Writing data (5.00 MB chunks): |████████████████████████| 4096/4096 [100%]
Step 7: Verify the Raw Dump
Confirm the raw dump was created:
# Check file size (should match VM RAM)
ls -lh ~/malware_analysis/memory_dumps/Malware_20251219_143022.raw

# Verify it's raw format
file ~/malware_analysis/memory_dumps/Malware_20251219_143022.raw
Expected output:
-rw-r--r-- 1 analyst analyst 4.0G Dec 19 14:40 Malware_20251219_143022.raw

Malware_20251219_143022.raw: data
Step 8: Using the Raw Dump with Volatility 3 (Optional)
Now that you have a raw memory dump, you can use it with Volatility 3 for analysis:
# Volatility 3 uses a different command structure
# No profile needed - it auto-detects Windows version

#Load image in Volatility 3
python vol3.py -f Malware_20251219_143022.raw windows.pslist

# List processes with Volatility 3
python3 vol3.py -f Malware_20251219_143022.raw windows.pslist

# Check network connections
python3 vol3.py -f Malware_20251219_143022.raw windows.netscan

# Scan for malware
python3 vol3.py -f Malware_20251219_143022.raw windows.malfind
Key Differences in Volatility 3:
No
--profileparameter needed (auto-detection)Plugin names use dots:
windows.pslistinstead ofpslistSimpler command structure
Faster execution on modern systems
Download Volatility 3:
Installation:
pip3 install volatility3
Powershell (How I used it)
# Used Standalone windows executable for volatility 2.6
C:\..\..\volatility_2.6_win64_standalone\volatility_2.6_win64_standalone.exe -f .\..\Malware_20251219_143022.elf imagecopy -O Malware_20251219_143022.raw

# Created a virtual environment
python -m venv memoryforensics

# Activated the environment
.\memoryforensics\Scripts\Activate.ps1

# Install volatility 3
pip install volatility3

# Run imageinfo on memory capture
vol.exe -f Malware_20251219_143022.raw windows.info

# continue to analyze
Determining the Correct Volatility Profile (For Volatility 2.6 Original and Still works)
To analyze the memory dump, you need the correct Windows profile. Here’s how to find it:
Method 1: Using imageinfo (Slower but Comprehensive)
# Run imageinfo to detect the profile
python vol.py -f Malware_20251219_143022.raw imageinfo
Sample output:
Volatility Foundation Volatility Framework 2.6.1
INFO    : volatility.debug    : Determining profile based on KDBG search...
          Suggested Profile(s) : Win10x64_19041, Win10x64_18362
                     AS Layer1 : SkipDuplicatesAMD64PagedMemory (Kernel AS)
                     AS Layer2 : FileAddressSpace
                      PAE type : No PAE
                           DTB : 0x1aa002L
                          KDBG : 0xf80207a422a0L
          Number of Processors : 2
     Image Type (Service Pack) : 0
                KPCR for CPU 0 : 0xfffff80207a8b000L
                KPCR for CPU 1 : 0xffff9c0f5b800000L
Use the first suggested profile (in this case: Win10x64_19041)
Method 2: Using kdbgscan (Faster)
# Quick profile detection
python vol.py -f Malware_20251219_143022.raw kdbgscan
Example Analysis Workflow
Now that you have a raw memory dump, here are some common analysis commands:
1. List Running Processes
python vol.py -f Malware_20251219_143022.raw --profile=Win10x64_19041 pslist
2. Scan for Hidden Processes
python vol.py -f Malware_20251219_143022.raw --profile=Win10x64_19041 psscan
3. Check Network Connections
python vol.py -f Malware_20251219_143022.raw --profile=Win10x64_19041 netscan
4. Extract Process Memory
# Dump a specific process (e.g., PID 1234)
python vol.py -f Malware_20251219_143022.raw --profile=Win10x64_19041 \
    memdump -p 1234 --dump-dir=~/malware_analysis/volatility_output/
5. Search for Malicious Strings
# Extract strings from specific process
python vol.py -f Malware_20251219_143022.raw --profile=Win10x64_19041 \
    strings -p 1234 -s suspicious_strings.txt
Automated Workflow Script
Here’s a complete bash script to automate the entire process:
#!/bin/bash
# vm_memory_capture.sh - Automated VirtualBox memory capture and conversion

VM_NAME="$1"
OUTPUT_DIR="$2"

if [ -z "$VM_NAME" ] || [ -z "$OUTPUT_DIR" ]; then
    echo "Usage: $0 <VM_NAME> <OUTPUT_DIR>"
    exit 1
fi

# Create output directory
mkdir -p "$OUTPUT_DIR"

# Generate timestamp
TIMESTAMP=$(date +%Y%m%d_%H%M%S)
ELF_FILE="$OUTPUT_DIR/memory_dump_${TIMESTAMP}.elf"
RAW_FILE="$OUTPUT_DIR/memory_dump_${TIMESTAMP}.raw"

echo "============================================================"
echo "VirtualBox Memory Capture - $VM_NAME"
echo "============================================================"

# Step 1: Pause VM
echo "[1/5] Pausing VM..."
VBoxManage controlvm "$VM_NAME" pause
sleep 5

# Step 2: Verify VM is paused
VM_STATE=$(VBoxManage showvminfo "$VM_NAME" --machinereadable | grep "VMState=" | cut -d'"' -f2)
if [ "$VM_STATE" != "paused" ]; then
    echo "ERROR: VM is not paused (state: $VM_STATE)"
    exit 1
fi
echo "      VM paused successfully"

# Step 3: Dump memory
echo "[2/5] Dumping VM memory to ELF format..."
VBoxManage debugvm "$VM_NAME" dumpvmcore --filename="$ELF_FILE"

# Verify ELF dump
if [ ! -f "$ELF_FILE" ]; then
    echo "ERROR: Memory dump failed"
    exit 1
fi
ELF_SIZE=$(du -h "$ELF_FILE" | cut -f1)
echo "      ELF dump created: $ELF_SIZE"

# Step 4: Resume VM
echo "[3/5] Resuming VM..."
VBoxManage controlvm "$VM_NAME" resume
sleep 2
echo "      VM resumed successfully"

# Step 5: Convert to raw format
echo "[4/5] Converting ELF to raw format with Volatility..."
python ~/tools/volatility/vol.py \
    -f "$ELF_FILE" \
    --profile=Win10x64_19041 \
    imagecopy \
    -O "$RAW_FILE"

# Verify raw dump
if [ ! -f "$RAW_FILE" ]; then
    echo "ERROR: Conversion failed"
    exit 1
fi
RAW_SIZE=$(du -h "$RAW_FILE" | cut -f1)
echo "      Raw dump created: $RAW_SIZE"

# Step 6: Summary
echo "[5/5] Memory capture complete!"
echo ""
echo "============================================================"
echo "RESULTS:"
echo "============================================================"
echo "ELF Dump:  $ELF_FILE ($ELF_SIZE)"
echo "Raw Dump:  $RAW_FILE ($RAW_SIZE)"
echo ""
echo "Next steps:"
echo "  1. Run: python vol.py -f $RAW_FILE --profile=Win10x64_19041 pslist"
echo "  2. Run: python vol.py -f $RAW_FILE --profile=Win10x64_19041 netscan"
echo "============================================================"
Usage:
chmod +x vm_memory_capture.sh
./vm_memory_capture.sh "Windows10-Malware-Lab" ~/malware_analysis/memory_dumps
Troubleshooting Common Issues
Issue 1: “Command not found: VBoxManage”
Solution: Add VirtualBox to your PATH:
# Linux/macOS
export PATH=$PATH:/usr/local/bin

# Windows (PowerShell)
$env:Path += ";C:\Program Files\Oracle\VirtualBox"
Issue 2: “Profile detection failed”
Solution: Manually specify the profile or use kdbgscan:
# Try kdbgscan for profile detection
python vol.py -f dump.elf kdbgscan

# If that fails, list all profiles
python vol.py --info | grep Profile
Issue 3: “Conversion is very slow”
Solution: This is normal for large memory dumps (4GB+). Expect:
4 GB: ~3-5 minutes
8 GB: ~8-12 minutes
16 GB: ~15-20 minutes
Issue 4: “VM won’t resume after dump”
Solution: Force poweroff and restore snapshot:
# Force poweroff
VBoxManage controlvm "YourVMName" poweroff

# Restore to clean snapshot
VBoxManage snapshot "YourVMName" restore "Clean"

# Restart
VBoxManage startvm "YourVMName" --type headless
Best Practices
Always pause before dumping - Ensures consistent memory state
Use descriptive filenames - Include malware family, date, and sample hash
Keep both ELF and raw - ELF for backup, raw for analysis
Verify file sizes - Should match VM’s configured RAM
Document your profile - Note the Windows version and build for future reference
Archive with metadata - Include sample info, analysis date, and VM configuration
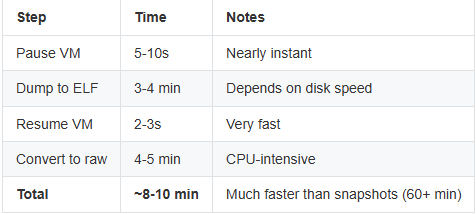
Performance Comparison
Here’s real-world timing data from capturing a 4GB Windows 10 VM:
Conclusion
Using VBoxManage debugvm dumpvmcore provides a fast, reliable method for capturing memory from malware analysis VMs. The combination with Volatility 2.6’s imagecopy plugin creates a streamlined workflow that:
✅ Completes in under 10 minutes
✅ Requires no in-VM tools
✅ Produces clean, analyzable dumps
✅ Works with all major forensic frameworks
This approach has become the gold standard for automated malware analysis pipelines, offering the best balance of speed, reliability, and forensic integrity.
Resources
Author’s Note: This has been battle test on a couple of different malware samples